Scatterplot visualization of hierarchically clustered data
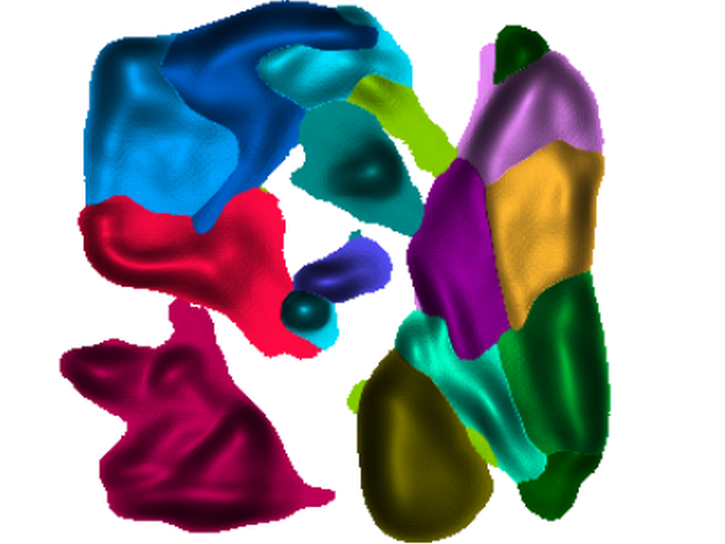
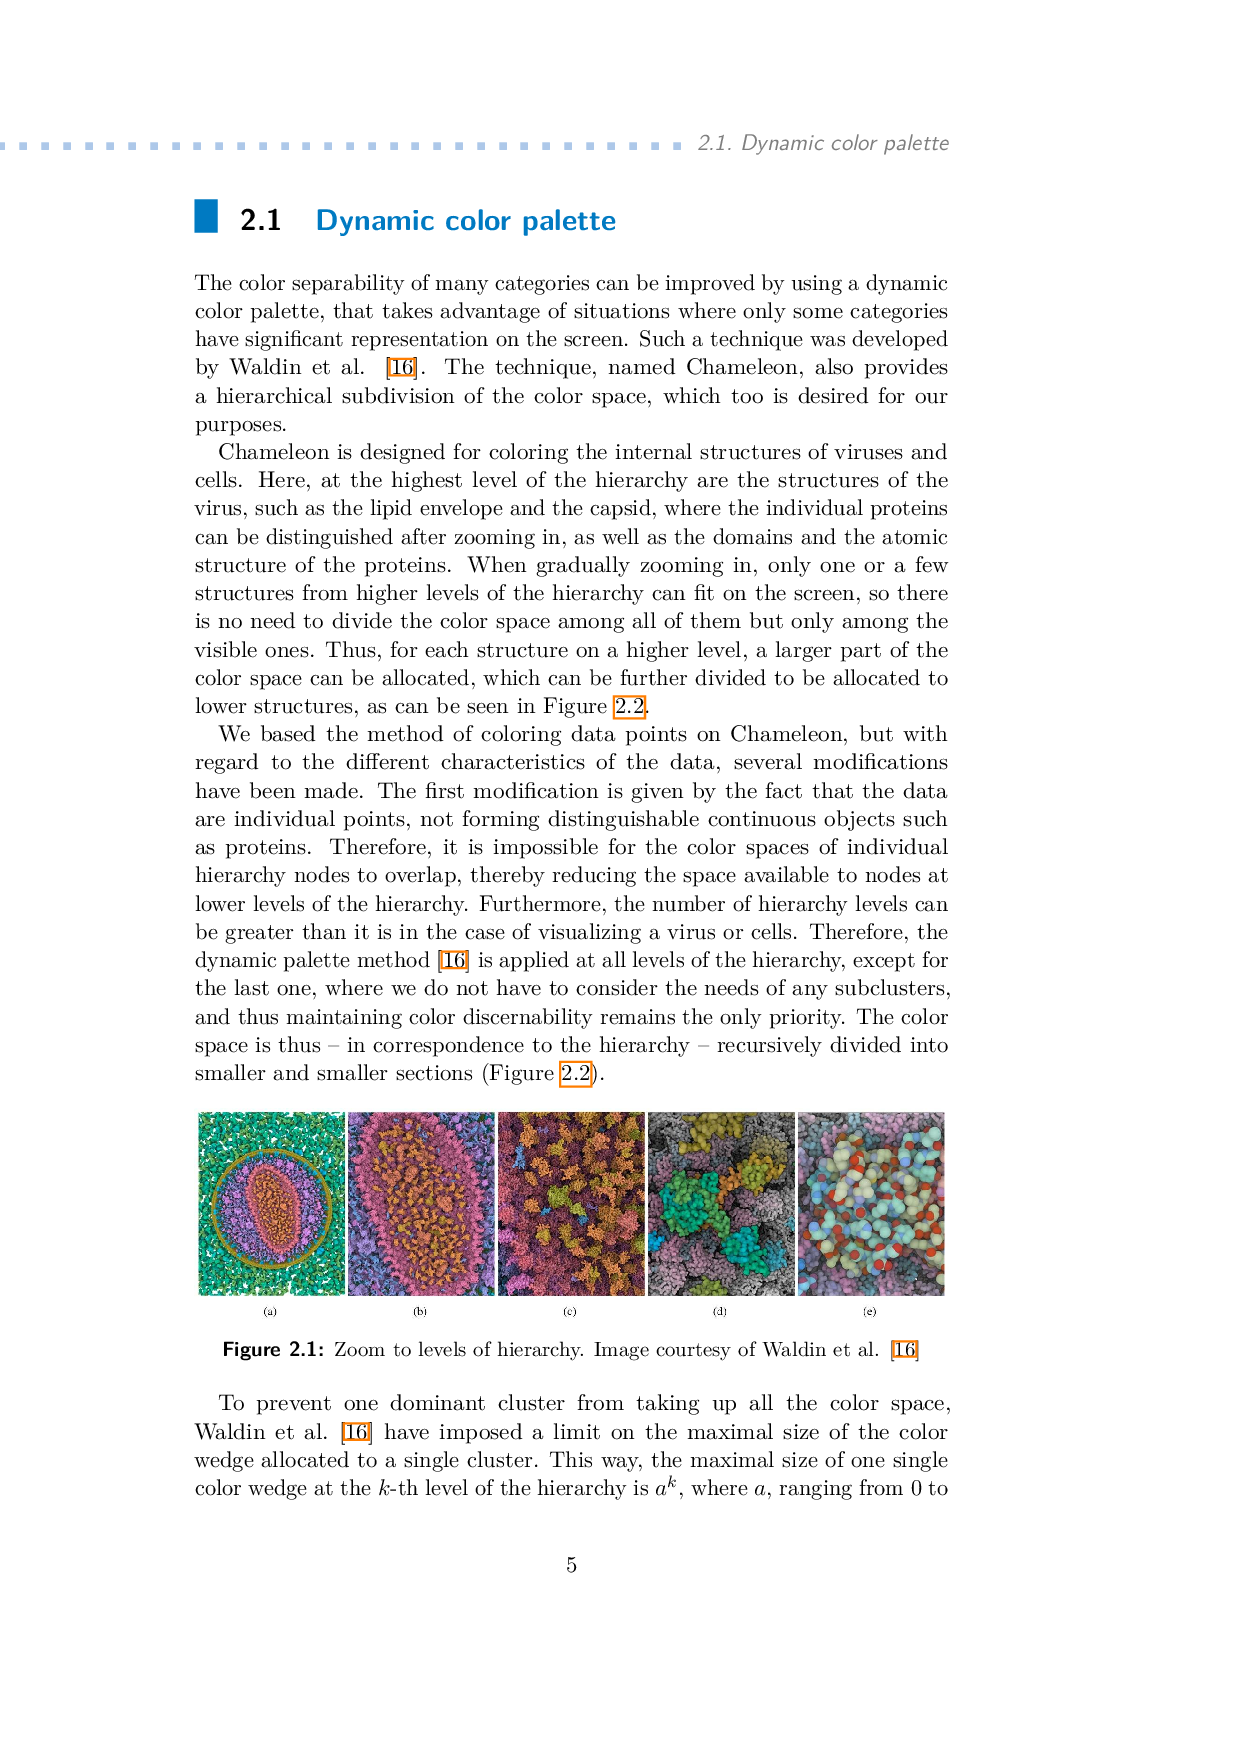
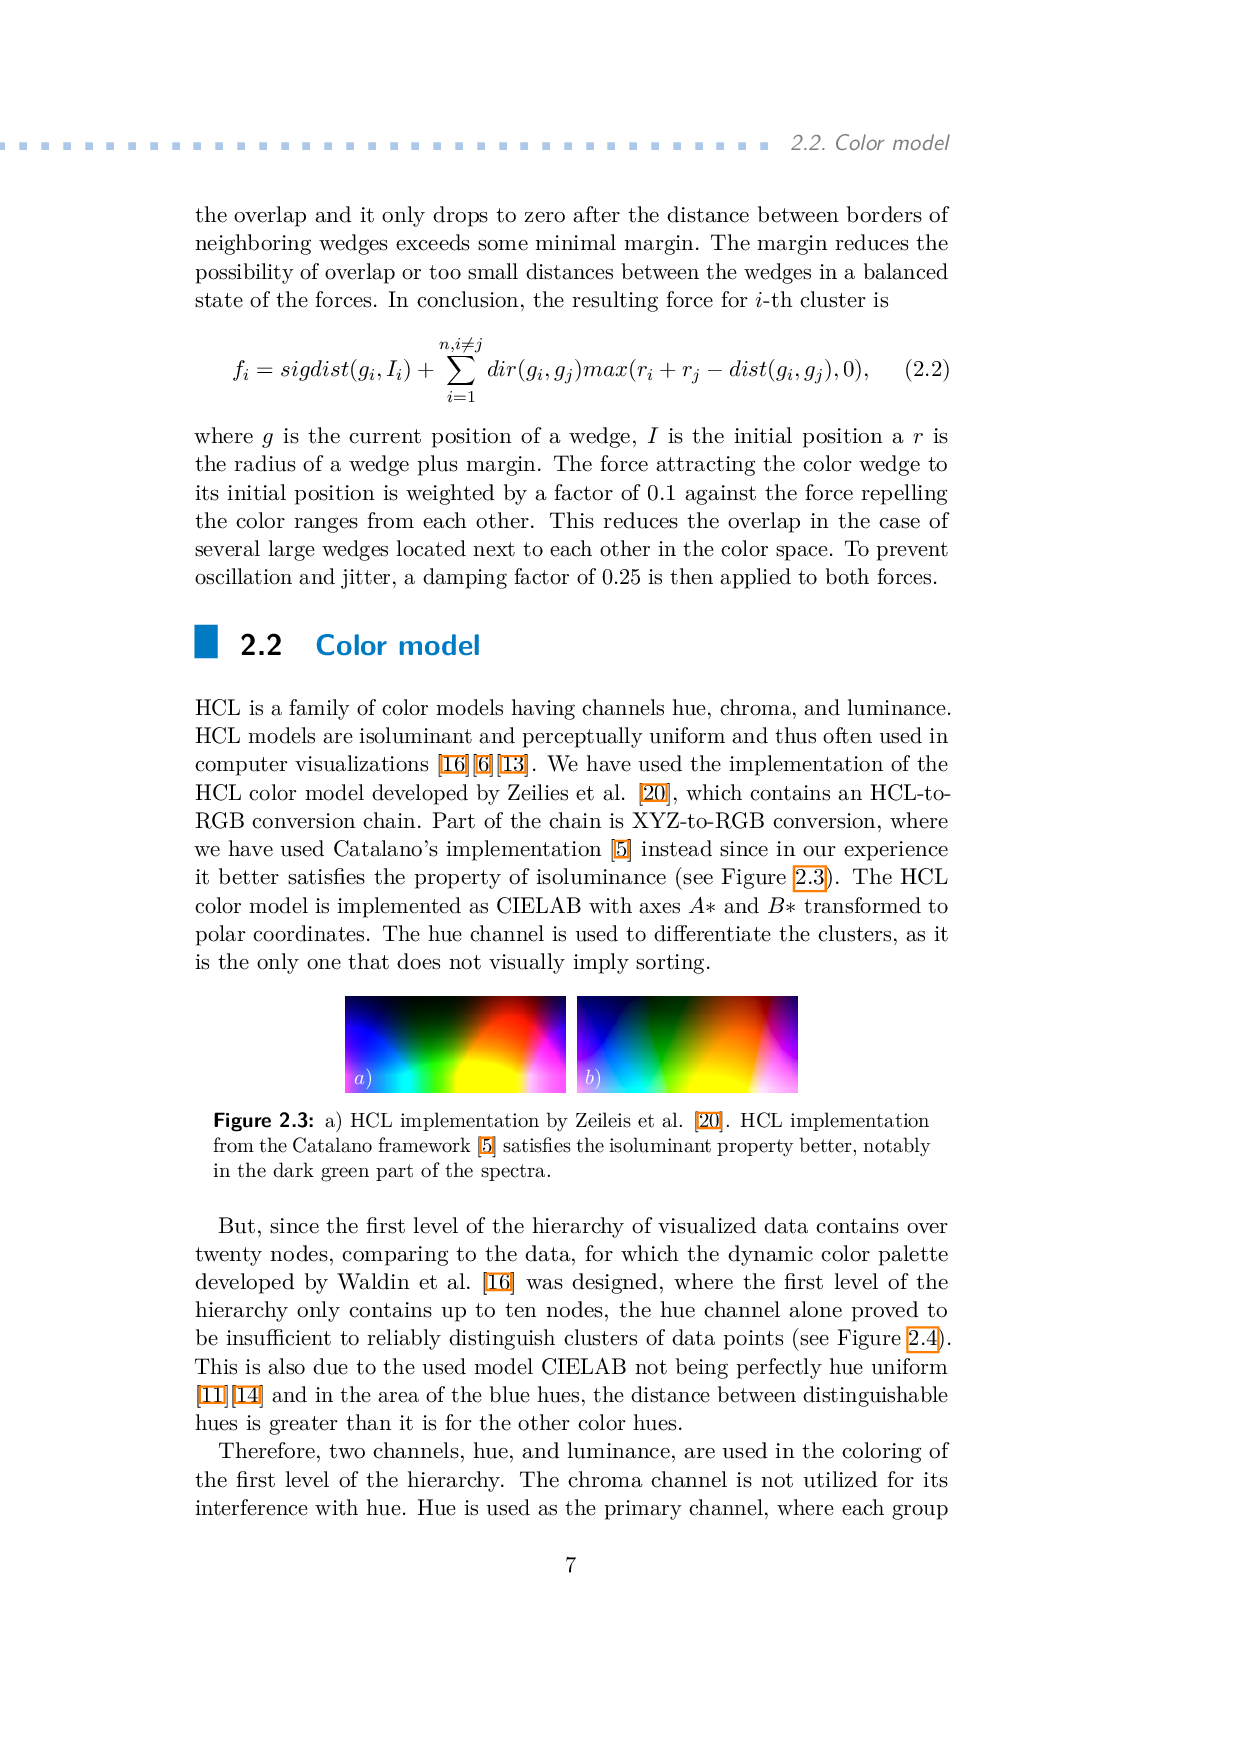
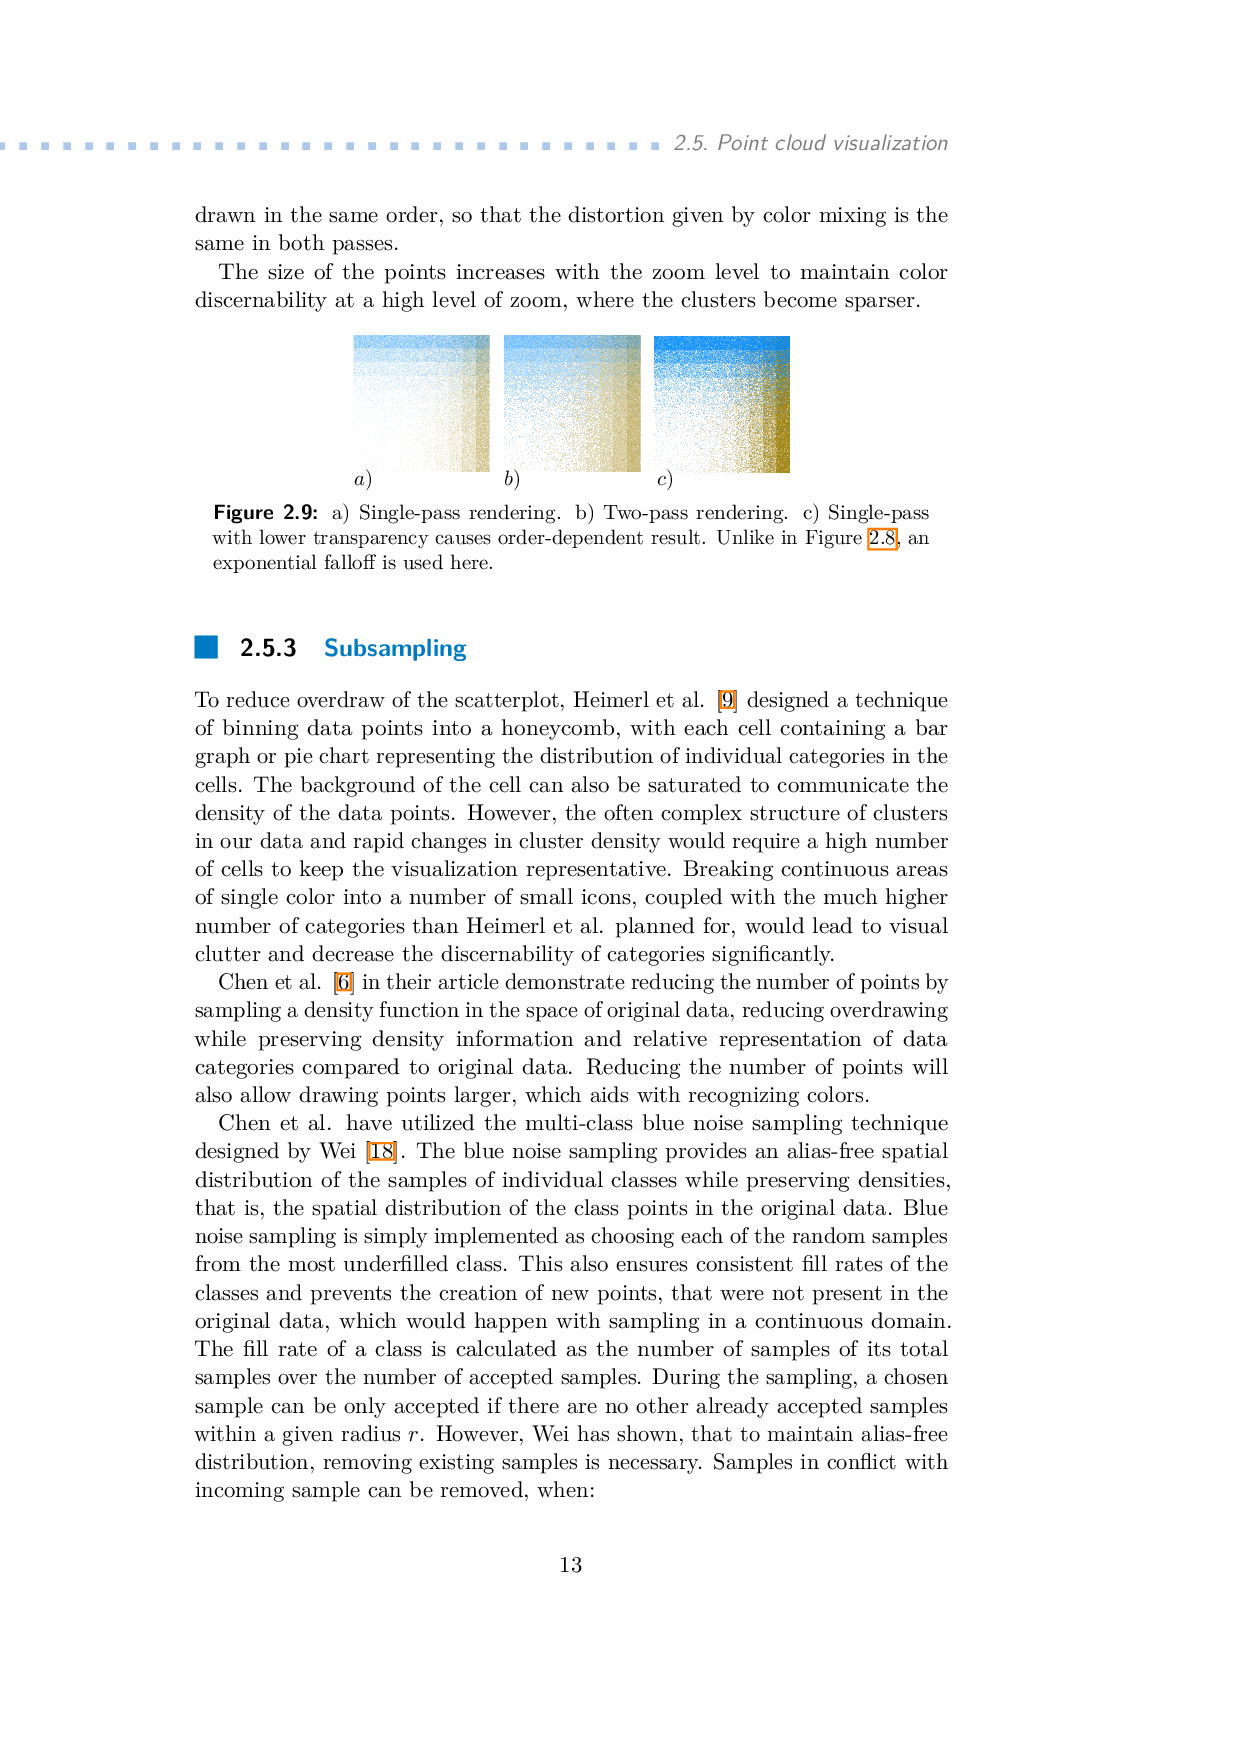
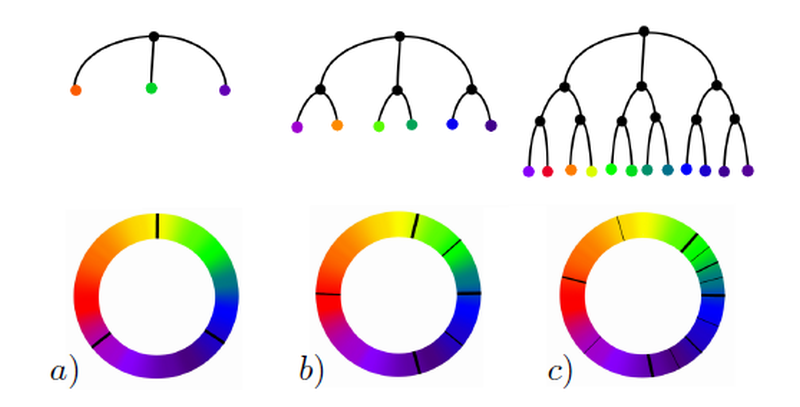
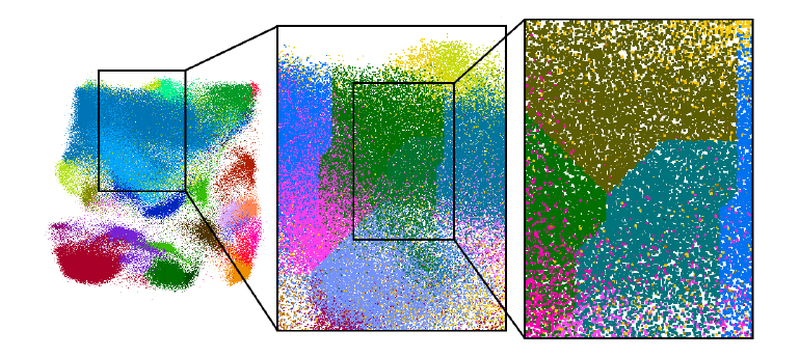
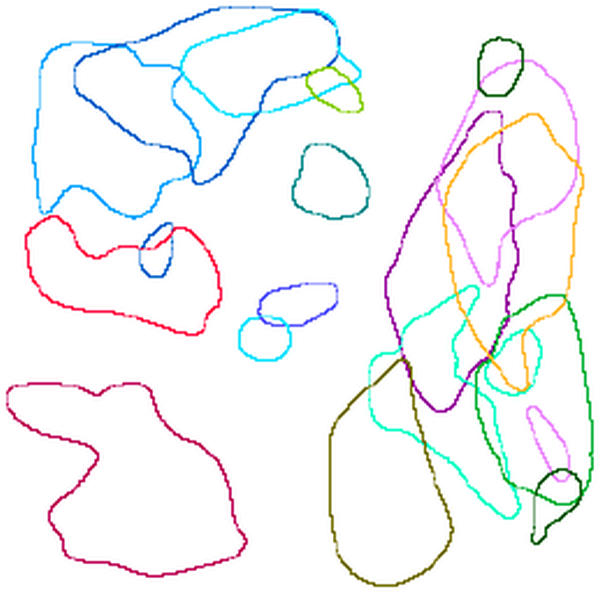
The focus of this work is interactive visualization of scatterplots with hundreds of thousands of data points where the points are organized into hierarchy of clusters. The visualization automatically selects color palette for the clusters of selected level. The selected level of the cluster hierarchy and the color palette are dynamically adjusted by zooming the scatterplot. Furthermore, the visualization improves visibility of the displayed clusters by reducing occlusion of the overlapping clusters. The visualization technique is demonstrated using two real medical datasets containing 2D coordinates of hundreds of thousands points.
