Visualization of spatiotemporal events
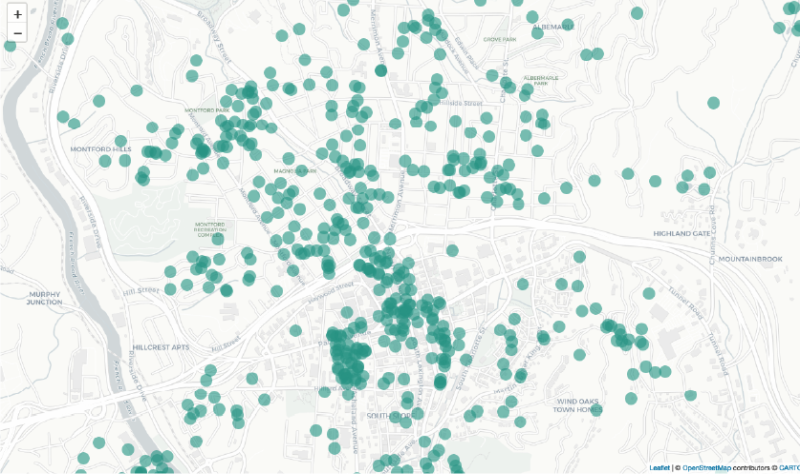
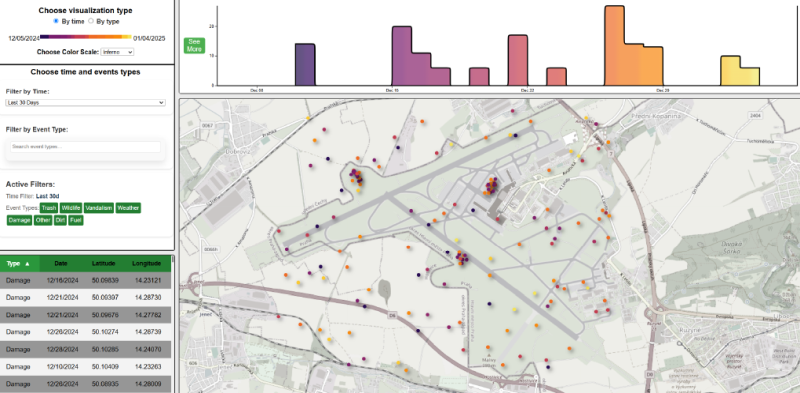
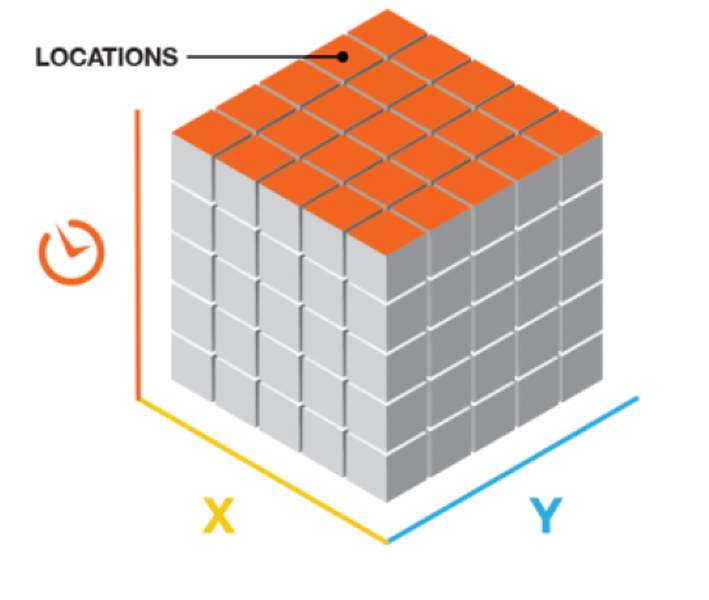
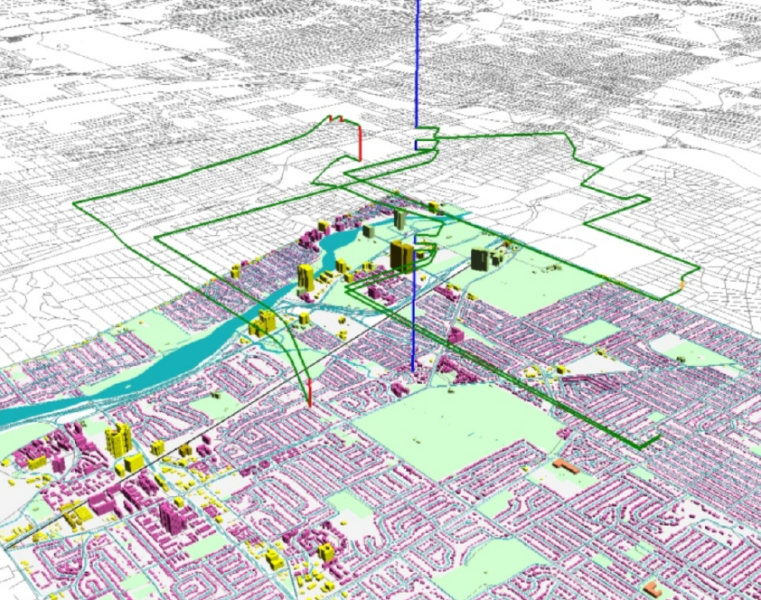
This Master's thesis focuses on making it easier to understand events that occur in both time and space. The work presents a tool that takes complex aviation data and shows it on an interactive map with supportive charts and table. This helps users quickly see patterns, filter information, and highlight important details. The application is built using D3.js, which allows for flexible and engaging visuals. Feedback from users guided the design, leading to a final solution that makes exploring data more intuitive. This work offers a new idea to support better decision-making in aviation and other fields where understanding when and where things happen is key.
Samples


Images